Shiba-kun: In-House Healthcare Assistant
Shiba-kun
By the year 2030, it is expected that 24.1% of the population in the Netherlands will be more than 65 years old, a demographic that is susceptible to chronic disorders like diabetes mellitus. Following the initiative of Delft University of Technology and Erasmus MC to design a “Consultation Room 2030”, a 5-week joint research project with the University of Tsukuba was proposed to develop Shiba-kun, a household robot assistant for patients with diabetes, which will be part of the healthcare ecosystem in 2030.
Physical Design
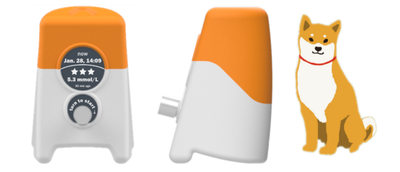
To avoid the “Uncanny Valley” (aversion toward robots that closely resemble humans), Shiba-kun follows an animal-inspired shape design. It resembles a Japanese Shiba-Inu in the sitting position to encourage users to consider the robot as a pet, instead of just a healthcare device.
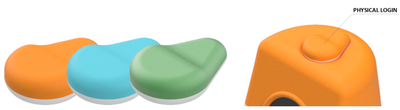
Accounting for single and multi-user households, an NFC physical device was added as the user id. This was decided to encourage physical interaction with the device, establishing a spatial aspect to the interaction.
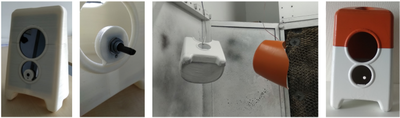
The chassis of the robot was fast prototyped using the Ultimaker S3 3D printer. The prototype was then primed and spray painted.
Input and Display Interface
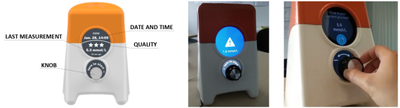
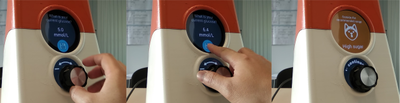
Shiba-kun uses two circular displays, one for the main content in the upper area and another to add extra information around the knob. To make the functional prototype, a 7.85 inch tablet was placed behind the 3D printed chassis.
The main input method is a 35 mm knob, a familiar interface in physical devices. Knobs are ideal to increase/decrease a value (e.g. volume control), linear scrolling (e.g. radio frequency tuning) or time control (e.g. clock dial), interactions that will be used to input glucose data and review historical information in the robot.
Interface Design
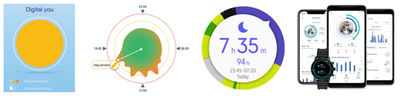
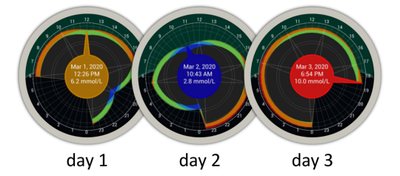
Based on the user interaction designed by van der Velden and Yan, and taking inspiration in the user interface of circular displays, a circular visual interface was designed to display historical data of glucose measurements. Circular plots are ideal to represent periodical data and time dependent information.
Instead of just a numerical value (often presented as Xmmol/l), the glucose value is computed with the historical information of the user and categorized into five levels, represented with a thermal color scale:
- Extremely High (red): the current glucose value is too high from the recommended range and an immediate action must be taken by the user.
- High (orange): the current glucose value is higher that the recommended level and the user should take care of their condition, but no immediate action is required.
- Normal (green): the current glucose value is within the recommended level.
- Low (light blue): the current glucose value is lower than the recommended range and the user should take care of their condition, but no immediate action is required.
- Extremely Low (blue): the current glucose value is too low from the recommended range and an immediate action must be taken by the user.
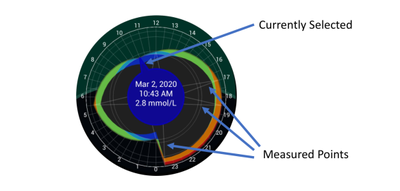
A 24-hour dial with 00 hours starting at the bottom was chosen to display daily historical data of glucose values. Inward values show lower glucose measures and outward values represent higher ones.
Each measurement of the user is added to the plot and is shown as triangles pointing at the measured time. The central circle shows detailed information on the currently selected measurement. Rotating the dial to the left selects older measurements, while rotating it to the right selects newer records.
Different display layouts were tested to show the records. The initial design showed data as a solid dial, then the inside of the dial was obscured to highlight the outer border, with the final version only showing the outer border.
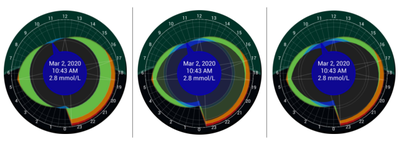
This layout makes comparing daily/weekly/monthly data visually easier, and helps identify at a glance which days the user was within range and which days there were fluctuations.
Recording Measurements
For the functional prototype, manual input of the glucose reading is required. By the year 2030, it is expected that automatic synchronized devices will be available in the market and the robot Shiba-kun will update its information from the cloud.
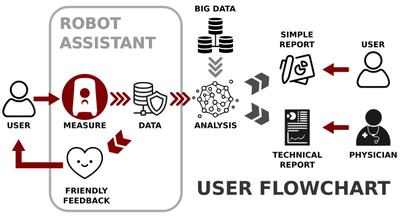
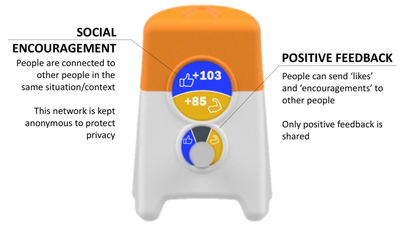
After each measurement, the user can provide positive feedback to patients in the same situation as the user. This feedback can motivate goal pursuit. Positive feedback is helpful to foster long-term motivation and when patients feel that the feedback provided is empathic and guiding, rather than critique, their acceptance increases. Big data analysis will be used to classify the user into clusters with people in the same condition to provide feedback among those users. This interaction is non-verbal and no personal information is shared among users.
This information will be stored into the user’s account and can be reviewed later by the user or analyzed by the physician. The glucose analysis should be enhanced with information regarding physical activity and caloric intake. In the future, such data can be synchronized from other devices.
Development
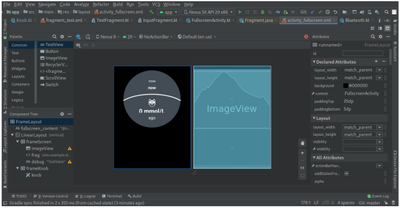
To create the working prototype, a 7.85 inch android tablet (Android 4.2.1) was used to work as the displays and process the interface. Android Studio 3.6.1 was used to program the device, with Kotlin as the main programming language.
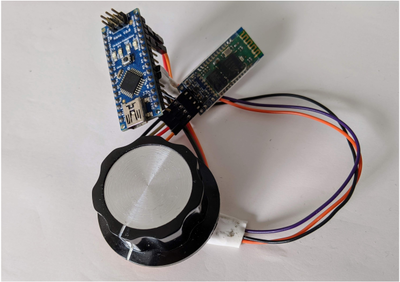
The knob is a rotary encoder connected to an Arduino Nano. To send the information of the rotary encoder to the tablet, a Bluetooth module attached to the microprocessor is wireless connected to the tablet.
Eiji Onchi
Space Production Engineer
PhD. in Kansei Science
Kansei designer and Mechatronic engineer, learning something new everyday.